
The second quarter of this year has witnessed a series of high price events in Queensland. These price spikes have been profoundly influenced by the dynamics associated with 5-minute dispatch, 30-minute settlement (hereafter ‘5/30’). By way of background, in the NEM dispatch occurs every 5-minutes yielding a dispatch price. However, settlement is based on half-hourly outcomes, with the price determined as the average of the six dispatch prices for each trading interval. These arrangements will end later this year when the ‘5-minute settlement’ rule comes into effect.
Against this backdrop, it seems timely to look at the effect that 5/30 arrangements have had on price outcomes in Queensland. We ask: how has 5/30 distorted price outcomes over the last decade?
Chart 1 – Quarterly average spot prices in bands in Queensland
We start with a review of price outcomes. Chart 1 shows the quarterly average Queensland spot price broken into two bands:
- Prices below $300 per MWh, shown in dark blue.
- Prices above $300 per MWh, shown in red.
The height of the bar represents the time-weighted average price for the quarter. The colour of the bars shows the contribution of different price levels to this quarterly average. The recent outcomes for Q2 represent the highest quarterly average spot prices seen in Queensland since the summer of 2016-17. The value in the cap is around $65 – amazing considering that Q2 is usually the ‘quiet quarter’.
Chart 1 – Q2 saw the highest average prices in Queensland since Q1 2017
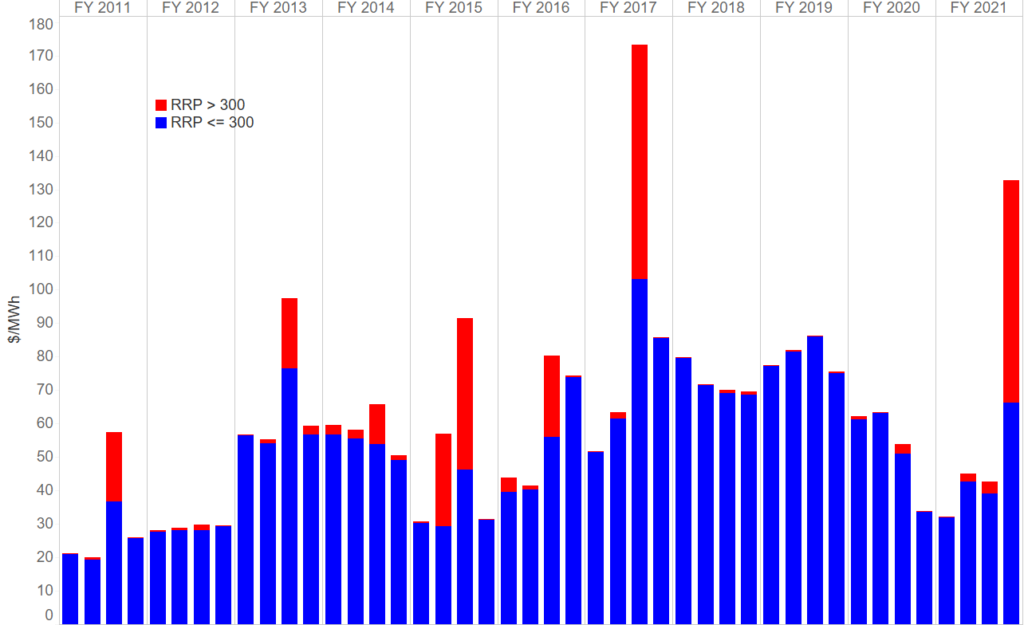
Quarterly average prices by price band, Queensland, FY2011 to FY2021
Chart 2 – Difference between average trading and dispatch prices
The starting point for an analysis of the effect of 5/30 arrangements is to compare average 5-minute and 30‑minute prices. Put another way, what is the difference between the price produced by the dispatch engine, and the price seen by the market? Chart 2 shows the average trading prices (in blue) versus the average dispatch prices (in green) for Queensland by time of day over the last decade.
The difference between these two lines is one measure of the inefficiencies introduced by the misalignment between settlement and dispatch – ie, by 5/30. The spikes that appear in the dispatch prices over the course of the day indicate periods when the average dispatch price exceeds the trading price. Similarly, there are periods where the dispatch price sits below the trading price. Assuming that the dispatch price signals the marginal value of generation, these divergences represent an inefficiency – the price paid by loads and received by generators is not signalling the marginal value of energy.
Chart 2 – Dispatch prices vary markedly from trading prices at certain times of the day
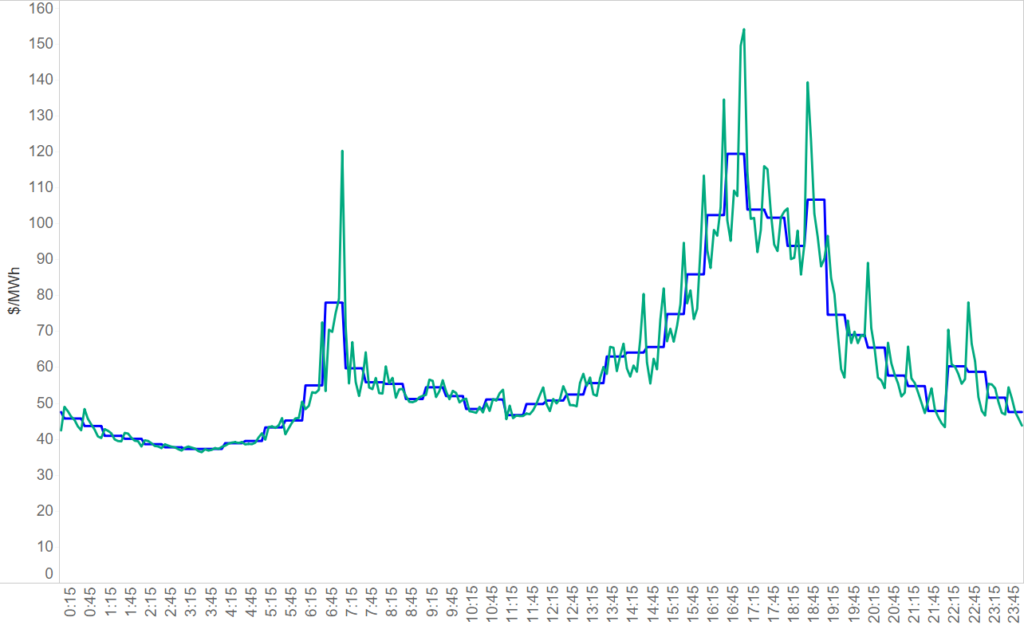
Average dispatch prices versus average trading prices for Queensland by time of day, FY2011 to FY2021
Chart 3 – Average divergence between trading and dispatch prices by dispatch interval
We have shown that under 5/30 the dispatch price diverges from the trading price. But there seems to be some structure to the spikes – why do they occur at regular intervals? Chart 3 examines when the divergences occur within the trading interval. By way of explanation:
- Each bar on the chart represents the difference between the average dispatch price and the average trading price for that dispatch interval (ie, dispatch intervals 1-6).
- We have highlighted the outcomes in the first dispatch interval (ie, ‘DI 1’) in blue and the last dispatch interval (ie, ‘DI 6) in red.
- Each panel shows the results a different financial year.
Chart 3 – The structure of the price spikes has changed over time in Queensland
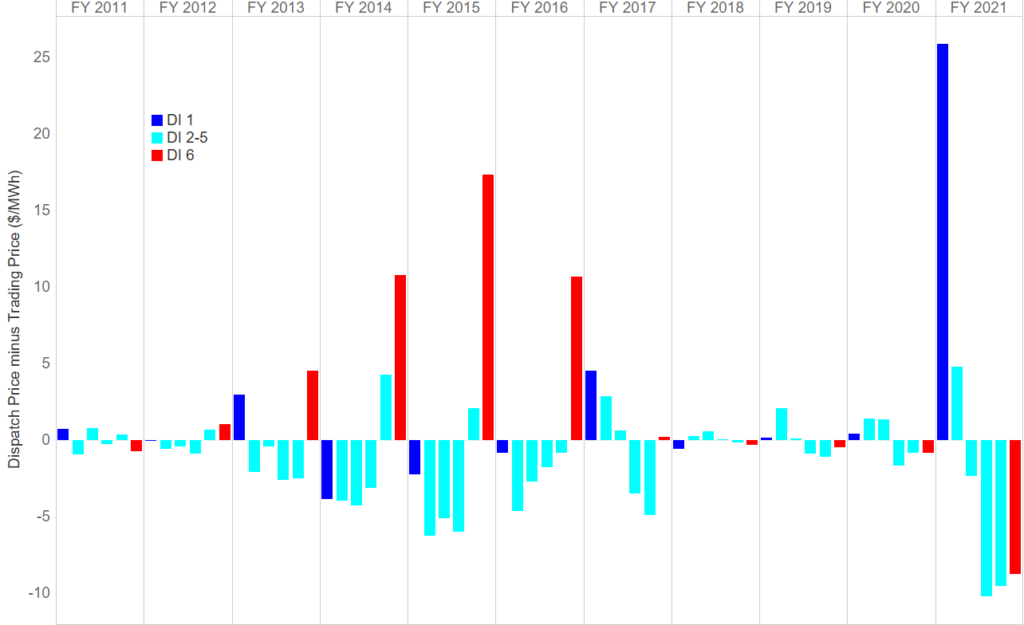
Average difference between trading price and dispatch price by dispatch interval for QLD, FY2011 to FY2021
The structure of the divergences between dispatch and trading prices has varied markedly over time. In the period from FY2013 to FY2016, prices tended to spike in the last dispatch interval of the trading interval. But in FY2021 the price spikes have occurred in the first dispatch interval. Both outcomes are inefficient.
To put these results into perspective, the DI1 and DI2 values for FY2021 suggest that trading revenue for the first dispatch interval was around $250 million less than the implied dispatch revenue. Similarly, the trading revenue for DIs 3,4,5 and 6 was around $250 million more than the implied dispatch revenue.
Our two cents
- Our analysis works on the basis that the dispatch prices are themselves efficient. We do not for a second think that this is the case. The current structure of dispatch prices is a result of 5/30. So insidious is the effect of 5/30 that it has distorted the dispatch prices themselves. When 5-minute settlement starts, expect to see a drastically different profile of dispatch prices.
- Much has been made of the cost of switching to 5-minute settlement. But even a simple estimate of the misallocation of trading revenue would be in the order of hundreds of millions of dollars per year per region. As we transition to a high penetration renewable market, the need for energy will vary from one dispatch interval to the next. Keeping the current arrangement was never a viable option for this new world. We aren’t going to shed any tears about the end of 5/30. Bring on 5-minute settlement.

For the last couple of weeks, the energy industry has been dominated by discussions about the long foreshadowed closure of Read more

Following the announcement of the National Energy Guarantee, the sector has been awash with speculation about the specifics of this Read more

Since the release of Dr Finkel’s review, the term ‘dispatchable generation’ has been appearing more and more across the NEM. Read more