Note: This article was first featured on WattClarity.
As the NEM transitions to a generation mix increasingly made up of wind and solar it is becoming increasingly important to understand the impact of constraints on dispatch. The NEM dispatch engine (NEMDE) runs a security-constrained economic dispatch, a complex linear optimisation which seeks to find the least cost way to match supply and demand while maintaining a secure and reliable power system.
To achieve this, NEMDE includes thousands of constraints which represent the underlying physical limitations of the system. For a detailed explanation of how these constraints are represented and why they are important for dispatch, see these helpful articles by Allan O’Neil and Julius Susanto.
Understanding how different constraints can impact on dispatch prices, quantities and flows is critical for market participants, investors and regulators to understand. For example, Dylan McConnell recently tweeted about the persistent $50/MWh price difference between the north and south regions of the NEM:
Update on the North vs South divide with respect to NEM pricing.
Pretty persistent ~$40-$50/MWh difference – quite a bit really!
(North = QLD & NSW, South = Vic, SA & Tas) pic.twitter.com/KS6TD2Q2qe
— Dylan McConnell (@dylanjmcconnell) March 30, 2023
In this article we explain how various constraints can impact upon modelled dispatch quantities, prices and flows across the power system. We begin by introducing the concept of a merit order which most readers will be familiar with. We then go through a NEMDE ‘re-run’ case study, in which we strip back NEMDE to a model without constraints and progressively add sets of constraints back into an optimisation model to compare dispatch outcomes across the different scenarios.
The merit order model
Dispatch is often explained with reference to a simplified merit order (or bid stack) model. Consider the following merit order example:
Electricity demand in this dispatch interval is 250 MW.
Generator A offers 100 MW of capacity at $50/MWh
Generator B offers 100 MW of capacity at $80/MWh
Generator C offers 100 MW of capacity at $100/MWh
Generator D offers 100 MW of capacity at $150/MWh
This example is shown in Figure 1.
Figure 1: Merit order example
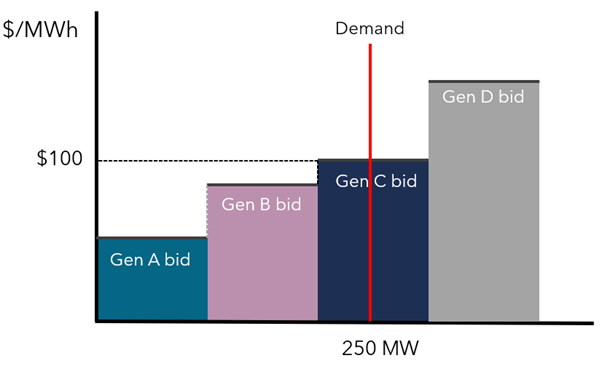
In this example,
Generator A is dispatched for its full 100 MW
Generator B is dispatched for its full 100 MW
Generator C is dispatched for 50 MW of its 100 MW bid
Generator D is not dispatched at all.
The the market clearing price is $100/MWh which is received by all dispatched generators.
However, suppose in this example there were transmission constraints preventing 60 MW from Generator B from reaching the load centre. In this case, 10 MW of Generator D would be required and the price would be set at $150/MWh.
This simple example shows how constraints can drive differences in dispatch and pool price outcomes. We can scale this up to look at how applying constraints to NEMDE’s optimisation affect outcomes for the entire NEM, starting with a ‘copper plate’ model.
Electricity market models
Electricity market models can vary in the level of detail they include torepresent the real-world power system. A copper plate model is an electricity market model that simplifies the representation of the transmission system by assuming that the entire network has unlimited transmission capacity and that electricity can be transmitted anywhere in the network without any losses. A copper plate model can be thought of as a system-wide version of the merit order example above.
The advantage of a copper plate model is that it is computationally less demanding and can therefore be run more quickly. However, the downside is that the results will generally be less reflective of actual dispatch outcomes, particularly when the missing constraints would have been binding.
A model that incorporates constraints, by taking into account transmission network limitations and security constraints, is more complex and takes greater resources to solve but is likely to more accurately reflect actual dispatch outcomes.
It is becoming increasingly important to represent constraints in electricity market models. The power system is transitioning from traditional large thermal generators located in strong parts of the transmission network to a generation mix largely made up of smaller, dispersed wind and solar generators. The technical characteristics of these resources and the correlated nature of their output means that constraints are increasingly binding in different parts of the network (see this recent piece on the X5 constraint by Allan O’Neil).
NEMDE re-run
To illustrate the impact of incorporating constraints in dispatch we re-ran NEMDE using an in-house model inspired by Nick Gorman’s excellent nempy (you can find out more about the package here).
We re-ran dispatch for the period April 2021 – March 2022 under multiple scenarios with progressively more constraint sets (this is sometimes called ‘back-casting’):
- Scenario 1 – Copper plate model with min and max generation constraints and ramp rate constraints but no network constraints
- Scenario 2 – Copper plate + interconnector constraints
- Scenario 3 – Copper plate + interconnector constraints + generic constraints (e.g. voltage and other stability constraints)
- Scenario 4 – Copper plate + interconnector constraints + generic constraints + FCAS
- Actual dispatch – actual dispatch outcomes including the full set of constraints invoked by NEMDE
Comparing these scenarios allows us to see the impact of introducing various constraints on dispatch outcomes such as dispatch prices, quantities and interregional flows.
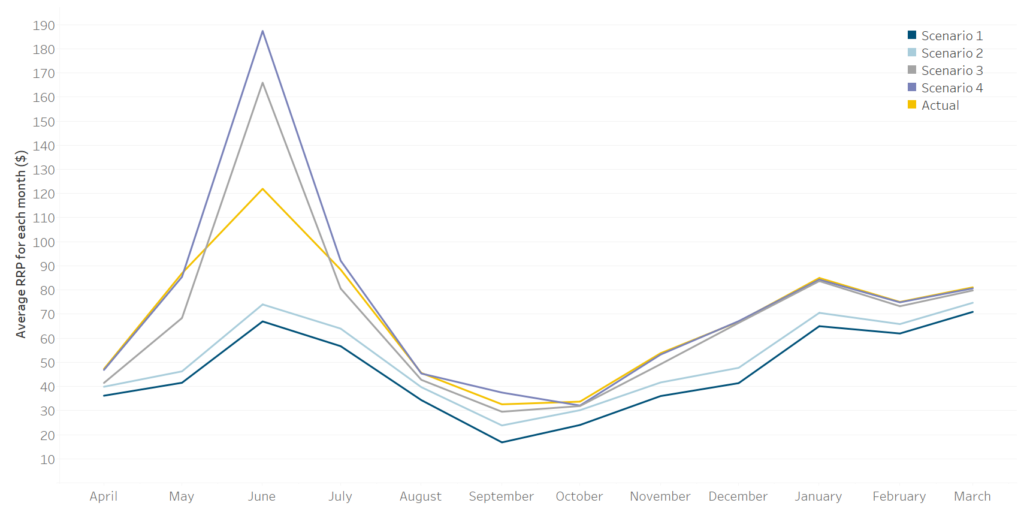
As you introduce more constraints, the least-cost solution for the entire NEM increases. This is because the optimisation must find the least cost solution while satisfying the set of constraints. The resulting dispatch mix is economically suboptimal relative to an unconstrained system with no losses. However, some constraints are more important than others. The inclusion of interconnector constraints (Scenario 2) does not make a significant difference to NEM-wide prices across this period. However, the inclusion of generic constraints (Scenario 3) drives a much larger increase in prices, particularly in June 2021.
However, we can see that while constraints lead to higher prices overall, this is not the case for all regions. In some cases, increasing the number of constraints can lower prices in some regions. The divergence of prices between the two regions is caused by restrictions on the volume of energy a region can import or export by interconnector constraints. When constraints bind, the importing region is forced to dispatch a higher-cost generator and thus prices increase in this region. Conversely, the exporting region’s price is set by a lower-cost generator than otherwise would be if unconstrained, therefore reducing pool prices. Figure 2 shows that actual dispatch prices are lower than Scenario 3 and 4 in Victoria and Tasmania across April 2021 – March 2022.
Figure 2: Average price by region
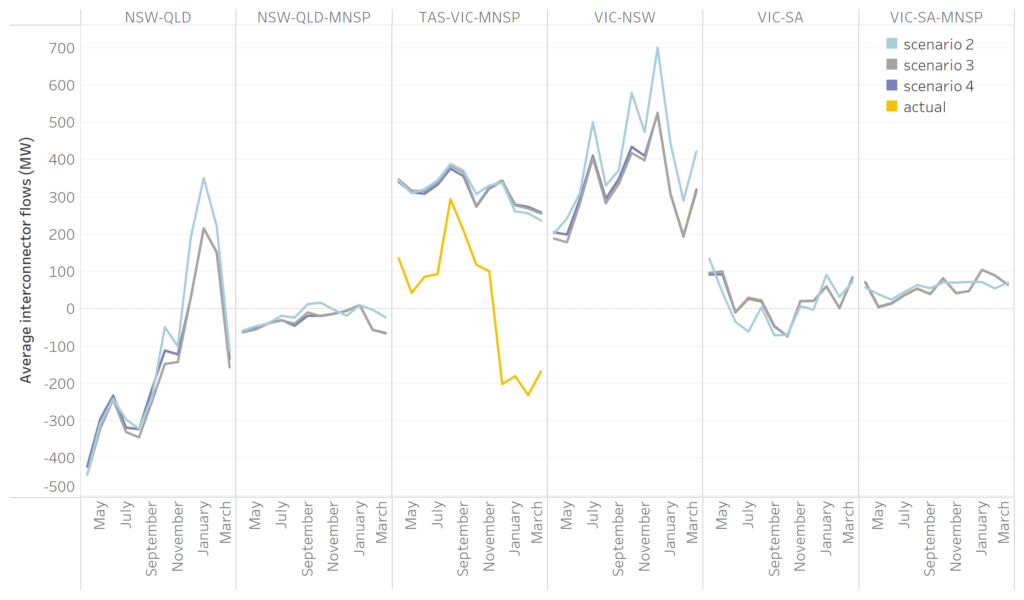
Different constraints also impact upon interconnector flows. In Figure 3 we see some differences in average flows between Scenario 2 and the other scenarios that include the generic constraints. Actual flows were quite close to Scenario 3 and 4 on average, except for Basslink flows between Victoria and Tasmania which diverged significantly from the other scenarios. Basslink operations are complex and are not well represented by the pared back modelling scenarios.
Figure 3: Average interconnector flows (excluding Scenario 1)
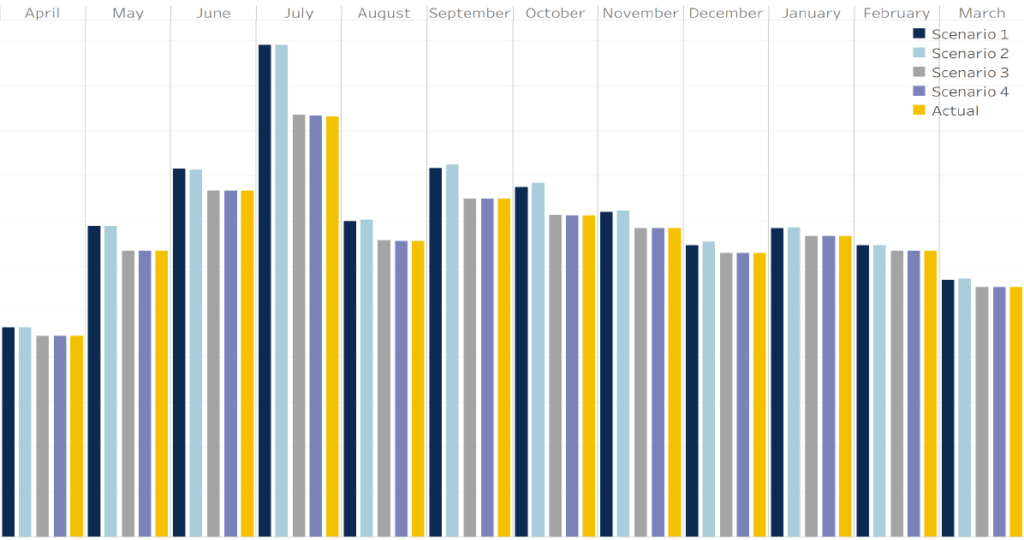
Turning to dispatch quantities by technology type, we generally see that additional constraints have a negative impact on dispatch outcomes for wind and solar which implies a degree of curtailment, largely due to generic constraints which includes intra-regional transmission congestion. This is due to the tendency of these variable renewable energy (VRE) generators to be located in areas with abundant renewable resources, but generally more remote, lower voltage areas of the network. This is in combination with the correlation between the generation output of these generators which leads to congestion on transmission lines, exacerbating the problem.
Figure 4 shows monthly wind dispatch for South Australia. We see here that wind dispatch is significantly lower if generic constraints are invoked.
Figure 4: Average dispatch for wind generation in South Australia (MW)
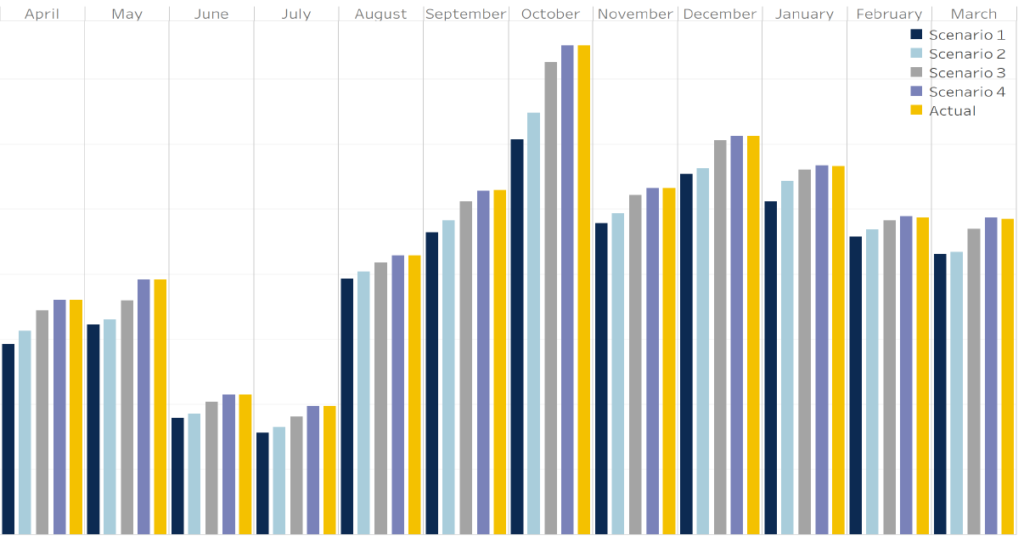
The opposite is the case for hydro where more constraints lead to greater hydro dispatch. Figure 5 shows the average dispatch for hydro in NSW across each scenario.
Figure 5: Average dispatch for hydro in NSW (MW)
In South Australia, applying more constraints generally lead to greater dispatch of gas-fired generation. Similarly, constraints tend to increase the dispatch of coal generation, particularly in Queensland. Binding transmission constraints result in the curtailment of lower-cost generation which is replaced by higher-cost generation located in less congested and stronger areas of the network. To meet demand under scenarios where transmission constraints are in effect, higher volumes of coal and gas are dispatched to replace curtailed renewable generation or lower-cost interregional generation.
Conclusion
As the power system transitions it is becoming increasingly important to understand and accurately model the impact of constraints on dispatch outcomes. Investors and developers should be well-informed about how constraints can impact the profitability of a project. Similarly, regulators and policymakers must carefully consider the implications for matters such as the economic benefits of transmission projects and how to design transmission access regimes.
The stylised bid stack, whilst elegant, masks the complexity of the market.

For the last couple of weeks, the energy industry has been dominated by discussions about the long foreshadowed closure of Read more

Following the announcement of the National Energy Guarantee, the sector has been awash with speculation about the specifics of this Read more

Since the release of Dr Finkel’s review, the term ‘dispatchable generation’ has been appearing more and more across the NEM. Read more